Rendering Mathematical Functions in XNA
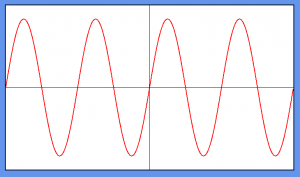
While working on part II of my Creating a Basic Synth in XNA series I thought it would be interesting to have some way to show a visual representation of the sound waves that we’ll be creating. Therefore I set out today to create a little component that does exactly that - render a graphic of some mathematical function - and which I’d like to share for educational purposes. Here’s the sort of image it produces:
However, please bear in my mind that my goal wasn’t to make it as flexible as possible but rather to make it work with the examples I needed. Because of that you definetly shouldn’t think of it as a general purpose renderer for any mathematical function, as there are numerous limitations that I chose not to address (such as dealing with values outside the chosen range and non-continuous functions).
Furthermore, because of the way the graphic is being drawn (which is actually by drawing many interconnected line segments using a SpriteBatch) it’s a given that this method should be extremely inefficient. But since I’ll only be using it for educational purposes I guess it will suffice.
Interface
I won’t go into many implementions detail here, but if you happen have any specific questions after reading the code (which you may find at the end of the article) then leave a comment and I’ll get back to you as soon as I can. All the functionality is contained in a class called MathFunctionRenderer, so let’s start by taking a look at its public interface:
public class MathFunctionRenderer
{
  public MathFunctionRenderer(GraphicsDevice graphicsDevice,
                                          int bufferSize = 500)

  MathFunctionDelegate MathFunction { set; }

  float Width { set; }
  float Height { set; }
  double RangeX { set; }
  double RangeY { set; }

  public void Update();
  public void Draw(SpriteBatch spriteBatch, float x, float y);
}
The most important part here is probably the delegate MathFunctionDelegate which is defined as follows:
public delegate double MathFunctionDelegate(double time);
What this means is that you basically only need to assign any function that takes a double as a parameter and returns a double to the MathFunction property of the class, and it will take care of creating a visual representation of that function for the specified range.
As for the rest of the properties, the Width and Height properties determine the size at which the graphic should be rendered. As for RangeX and RangeY, they are in charge of determining how much “zoom” the graphic should have. Basically if you set RangeX to 2.0 then you’ll be viewing values from x = -2.0 to x = 2.0 (and analogously for RangeY), but make sure you choose a RangeY large enough to hold the maximum values of your function, since the class is not currently doing any clipping.
You might have also noticed the optional bufferSize parameter of the constructor. Choosing an higher value there will result in a better visual quality, but will also be slower to execute, so just tweak it until you are satisfied with the results/performance. Essentially it controls how many points (and consequently how many line segments will be drawn) will be used to approximate your function.
When you assign a function to MathFunction, the graphic will be automatically recalculated for you. But if for some reason the content of your MathFunction changes, but the instance was left the same, you can force the component to update its buffers using the Update method. I needed to add this for special usage that I’ll explain at the end, but for normal cases you won’t need to call Update explicitally.
As for drawing, all you need to do is call the Draw method and pass it a SpriteBatch and position. Note that the class will currently call SpriteBatch.Begin and End for you.
How to use it
Using the class is extremely easy. Here’s an example that draws a simple sine wave:
// Here's the function we want to draw
static double SineWave(double time)
{
  return Math.Sin(time * 2 * Math.PI);
}

// On LoadContent
_mathFunctionRenderer = new MathFunctionRenderer(GraphicsDevice);
_mathFunctionRenderer.MathFunction = SineWave;

// On Draw
_mathFunctionRenderer.Draw(_spriteBatch, 10, 10);
And that’s it. Easy, right?
How does it work?
So, how exactly is this class doing all the rendering?
Well, in general terms what the class is doing is simply taking N equidistant points on the function, and drawing tiny little lines connecting each of them. The amount of points is decided on the constructor by the bufferSize parameter! We’re essentially “sampling” the function and creating a discrete representation of it. As the number of points increase, our results get smoother and we lose the impression that it’s all a bunch of connected lines, but still, that’s just what it is.
As for how I’m drawing the lines, I’m using a technique described here which involves creating a 1x1 white texture and transforming it with SpriteBatch in order to create 2D lines.
Adding frequency and amplitude
While MathFunctionRenderer only accepts functions that conform to the MathFunctionDelegate’s signature, I wanted to have a few extra parameters on my function - frequency and amplitude.
If this were C++, I’d be using a function adapter and binding parameters in order to “transform” a (time, frequency, amplitude) function into a (time) function. Doing this in C#, is quite different, but actually rather easy:
- Create a class with the extra parameters you wanted to use as members variables.
- Add a member function that conforms the MathFunctionDelegate but at the same time relies on the member variables that you created.
- Pass a refence to that member function to the MathFunctionRenderer.
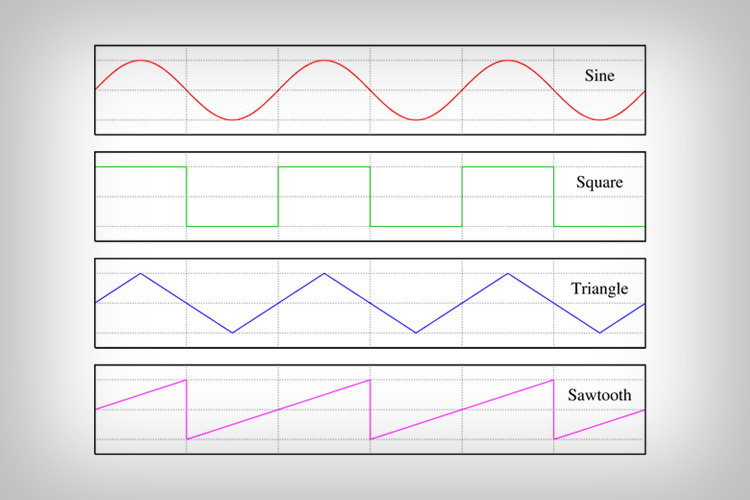
So I created the following class that is capable of creating several types of waves (the formulas used will be explained in the synth article) at different amplitudes and frequencies:
public class WaveFunction
{
  private static readonly Random Rng = new Random();

  public enum WaveType
  {
    Sine,
    Square,
    Sawtooth,
    Triangle,
    Noise,
  }

  public double Amplitude = 1.0;
  public double Frequency = 440.0;
  public WaveType Type = WaveType.Sine;

  public double MathFunction(double time)
  {
    switch (Type)
    {
      default /* WaveType.Sine */ :
        return Math.Sin(Frequency * time * 2 * Math.PI) * Amplitude;
      case WaveType.Square:
        return Math.Sin(Frequency * time * 2 * Math.PI) >= 0 ? Amplitude : -Amplitude;
      case WaveType.Sawtooth:
        return 2 * (time * Frequency - Math.Floor(time * Frequency + 0.5)) * Amplitude;
      case WaveType.Triangle:
        return Math.Abs(2 * (time * Frequency - Math.Floor(time * Frequency + 0.5))) * Amplitude;
      case WaveType.Noise:
        return (Rng.NextDouble() - Rng.NextDouble()) * Amplitude;
    }
  }
}
And then used it in conjunction with the MathFunctionRenderer class, like so:
_waveFunction = new WaveFunction();
_mathFunctionRenderer = new MathFunctionRenderer(GraphicsDevice);
_mathFunctionRenderer = _waveFunction.MathFunction;
With that, when I wanted to change the amplitude or frequency of the wave all I had to do was change it on my WaveFunction instance. The catch is that since MathFunctionRenderer isn’t aware of these changes (and I didn’t want to couple both classes together just for this reason), it’s necessary to give it a nudge with the Update method for the function to be recalculated.
Sample
You can see the sample in action in the video below, or download the source code and play with it yourself. Also, look forward to part II of my Creating a Basic Synth in XNA series in the next couple of days!